
Institutions
Asset classes
About us
In today’s private markets environment of slow exits, high liquidity constraints, and moderate growth, private capital investors would do well to focus not only on identifying top-performing fund managers, but those whose performance is consistent and repeatable.
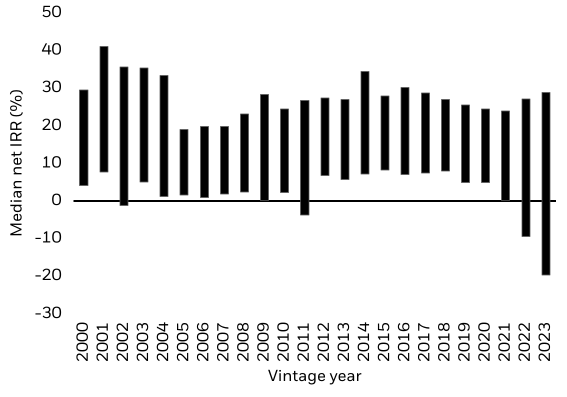
The widening dispersion in fund performance means this is more important than ever. Preqin data shows a growing gap between first- and fourth-quartile median net IRRs for buyout funds. For 2000 to 2021 vintage funds, the gap has been high, averaging 24.1 percentage points (ppts) (Fig. 1). Although this could partly be due to early‑vintage IRR volatility, recent years have seen even higher dispersion, with 36.7ppts in 2022 vintage funds and 48.5ppts in 2023.
Fig. 1: The dispersion between top and bottom performing buyout funds is widening
Median net IRR (%) for first quartile and fourth quartile buyout funds globally, 2000–2023
1.Preqin Pro. Data as of Jan 2026
To evaluate whether a manager’s historical outperformance can be sustained in future vintages, LPs need to run value-creation analysis of past returns. This enables them to distinguish between returns generated through operational improvements (such as revenue growth and EBITDA margin expansion) and cyclical or market-dependent factors (changes in net debt or multiple expansion).
Returns generated through operational improvements tend to be more resilient and repeatable across market cycles. Those driven by market-dependent factors are harder to control and sustain through different cycles.
To improve the manager selection process, investors need granular asset-level data—but struggle to access it in a standardized, consistent way
LPs are increasingly seeking asset-level data that can be broken down by sector, geography, strategy, investment professional, entry valuation, and exit multiples. This helps them understand:
• Which sectors and geographies have contributed most to realized performance
• How loss ratios vary across strategies and investment partners
• Whether deal outcomes are widely distributed or overly dependent on a few winners
• Whether returns come from operational improvement or multiple expansion
But this requires granular data, robust methodologies, and significant analytical effort—resources that are often stretched across growing private markets portfolios.
Data provided by GPs often comes in disparate formats, with inconsistent definitions or unstructured fields. It makes standardization difficult. Investment teams can spend disproportionate amounts of time cleaning, mapping, and rebuilding datasets before any real evaluation begins. This manual and fragmented process limits the number of managers that LPs can review in depth and can impede their search for top-performers.
This raises the need for investors to conduct essential asset-level analysis in a structured, scalable way, without the burden of navigating disparate GP datasets. To meet this challenge, eFront Insight now incorporates Preqin market intelligence and benchmarking alongside eFront analytics and managed data services, allowing LPs to outsource the collection, validation, and processing of fund and asset-level data
Using these new capabilities, investors can evaluate return drivers and strengthen their forward-looking conviction in potential managers.
Deal-level data across funds can be standardized, together with the use of peer group benchmarking, to consider a fund’s value-creation profile in the context of market conditions, and the sectors and vintages it invested in.
For example, an LP assessing GP X’s strategy could examine the value-creation drivers of its past funds and contrast them with the customized peer group benchmark available on the platform.
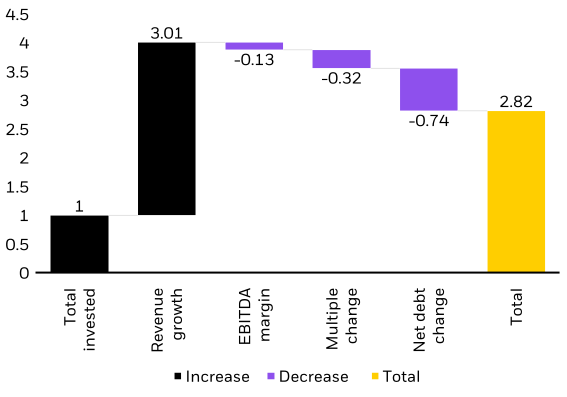
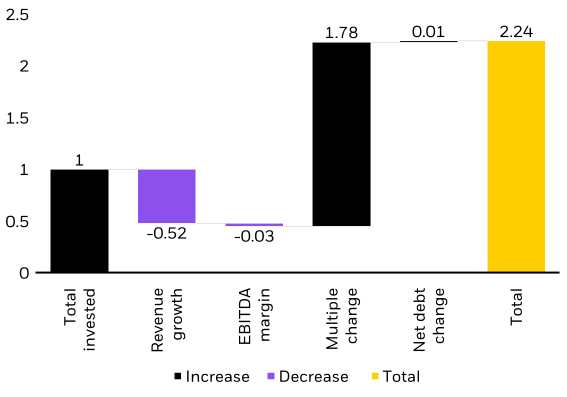
In the case of Fund X, every dollar invested generated a gross return of $2.24, comparable to the benchmark’s $2.82. But the decomposition showed that portfolio companies experienced declining revenue and EBITDA margins. Very little value came from operational improvement; instead, most of the performance (1.78x) was driven by rising market multiples. Comparable deals in the broader market had a much larger share of value created through revenue growth (3.01x) than changes in multiples or net debt (Fig. 2).
Fig. 2: Fund X performance was driven by growing multiples, and comparable deals by revenue growth
Value creation drivers for sample fund X and customized peer group benchmark
Fund X
Peer group benchmark
1. eFront Insight
These insights raise important questions about the durability of GP X’s strategy. In a higher interest rate environment, where debt is more expensive and valuation uplift is harder to achieve, managers cannot rely on leverage or multiple expansion to drive returns.
With greater transparency into how value is created, LPs are better equipped to answer critical pre-investment questions, including:
• How much value has been generated across a manager’s funds, and how consistently?
• How does this compare with an appropriately calibrated peer group?
• What were the primary drivers of returns?
• How repeatable is the quality of that value creation across deals and cycles?
End-to-end workflows powered by market data
This value-creation analysis is an example of how eFront Insight, with Preqin inside, enables LPs to digitize and standardize GP data for faster, more accurate analysis; perform attribution and prepare diligence materials efficiently; and view manager performance against benchmarks and peer groups for deeper insights.
Beyond these pre-investment capabilities, the platform also provides a comprehensive set of post-investment capabilities, including portfolio monitoring, exposure analysis, performance benchmarking, reporting at scale, fee oversight, and risk analytics.
eFront® Insight, with Preqin inside, delivers a holistic, pre- and post-investment solution for investors to plan, construct, and manage private market portfolios. Enriching the eFront platform’s analytics, workflows, and managed data services with premium market data provides LPs with a single ecosystem to make better decisions and unlock value across the entire investment lifecycle within the context of the market. To find out more about eFront Insight, click here.
ABOUT ALADDIN
Aladdin® is a technology platform used by asset managers and owners including banks, financial institutions, pensions, corporations, insurers, and wealth managers. The Aladdin platform unifies the investment management process, providing a common data language within an organization to enable scale, provide insights, and support business transformation. Through eFront® technology, alternative investment data management is covered to meet the needs of alternative investment professionals worldwide and across all major alternative asset classes. From fundraising, fund administration and reporting to data services and analytics, the platform provides capabilities to support decision making and investment oversight.
Aladdin® and eFront® platforms bring together public and private asset class data to create an industry-recognized whole portfolio solution for investment professionals globally. Find out more at www.blackrock.com/aladdin | request@blackrock.com
This material is provided for informational purposes only and is not intended to be relied upon as a forecast, research or investment advice, and is not a recommendation, offer or solicitation to buy or sell any securities or to adopt any investment strategy. The opinions expressed are subject to change at any time without notice. The information and opinions contained in this material are derived from proprietary and nonproprietary sources deemed by BlackRock to be reliable, are not necessarily all-inclusive and are not guaranteed as to accuracy. Performance and risk calculations, including those incorporated into Aladdin technology, are based on assumptions, historical correlations, and other factors (such as inputs provided by the Aladdin users) and are not assured to predict future results. All graphs and screenshots are for illustrative purposes only. BlackRock’s Aladdin platform is a financial technology platform designed for institutional, wholesale, qualified, and professional investor/client use only and is not intended for end investor use. Aladdin users undertake sole responsibility and liability for investment or other decisions related to the technology’s calculations and for compliance with applicable laws and regulations. The technology should not be viewed or construed by any Aladdin users, or their customers or clients, as providing investment advice or investment recommendations to any parties. For additional information on any of the descriptions contained herein, please contact your Aladdin Relationship Management representative. BlackRock may modify or discontinue any functionality or service component described herein at any time without prior advance notice to you.
Certain Aladdin technology products and services may not be offered by BlackRock in your local jurisdiction.
In the U.S. and Canada, this material is intended for institutional investors. In the UK, this material is for professional clients (as defined by the Financial Conduct Authority or MiFID Rules) and qualified investors only and should not be relied upon by any other persons. Please refer to the Financial Conduct Authority website for a list of authorised activities conducted by BlackRock. In the EEA, this material is for professional clients, professional investors, qualified clients and qualified investors. For qualified investors in Switzerland: This information is marketing material. This material shall be exclusively made available to, and directed at, qualified investors as defined in Article 10 (3) of the CISA of 23 June 2006, as amended, at the exclusion of qualified investors with an opting-out pursuant to Art. 5 (1) of the Swiss Federal Act on Financial Services ("FinSA"). For information on art. 8 / 9 Financial Services Act (FinSA) and on your client segmentation under art. 4 FinSA, please see the following website: www.blackrock.com/finsa. In Singapore, this is for use only with institutional investors as defined in Section 4A of the Securities and Futures Act, Chapter 289 of Singapore. In the provision of any of the services described herein, neither BlackRock (nor any of its affiliates) will be acting in a capacity as investment adviser or broker-dealer nor will it be performing the functions of an organized market or exchange (and has not been recognized as doing so by the Monetary Authority of Singapore). In Hong Kong, the technology and the material is for distribution to "Professional Investors" (as defined in the Securities and Futures Ordinance (Cap.571 of the laws of Hong Kong) and any rules made under that ordinance.) and should not be relied upon by any other persons or redistributed to retail clients in Hong Kong. In Japan, this is for Professional Investors only (Professional Investor is defined in Financial Instruments and Exchange Act). In Australia, issued by BlackRock Investment Management (Australia) Limited ABN 13 006 165 975 AFSL 230 523 (BIMAL) for the exclusive use of the recipient who warrants by receipt of this material that they are a wholesale client and not a retail client as those terms are defined under the Australian Corporations Act 2001 (Cth). In Brunei, Indonesia, and Malaysia, this material is issued for institutional investors only. In Latin America, for institutional investors and financial intermediaries only (not for public distribution). No securities regulator within Latin America has confirmed the accuracy of any information contained herein. Please note that IN MEXICO, the provision of investment management and investment advisory services (“Investment Services”) is a regulated activity, subject to strict rules, and performed under the supervision of the Mexican National Banking and Securities Commission (Comisión Nacional Bancaria y de Valores, the “CNBV”). BlackRock does not provide, and it shall not be deemed that it provides through [Aladdin or eFront] technology, any personalized investment advice to the recipient of this document, by reason of its use or otherwise. These materials are shared for information purposes only, do not constitute investment advice, and are being shared in the understanding that the addressee is an Institutional or Qualified investor as defined under Mexican Securities (Ley del Mercado de Valores). Each potential investor shall make its own investment decision based on their own analysis of the available information. Please note that by receiving these materials, it shall be construed as a representation by the receiver that it is an Institutional or Qualified investor as defined under Mexican law. BlackRock México Operadora, S.A. de C.V., Sociedad Operadora de Fondos de Inversión (“BlackRock México Operadora”) is a Mexican subsidiary of BlackRock, Inc., authorized by the CNBV as a Mutual Fund Manager (Operadora de Fondos), and as such, authorized to manage Mexican mutual funds, ETFs and provide Investment Services. For more information on the Investment Services offered by BlackRock Mexico, please review our Investment Services Guide available in www.blackrock.com/mx. In South Africa, a provider who provides products or services to a client other than financial products or financial services, must disclose to the client the fact that the additional products or services are not regulated under the Act and therefore the client is not afforded the same protections in respect of those additional products or services that may apply in respect of the provision of financial products or services in terms of the Act. This document is for information purposes only and does not constitute an offer or invitation to anyone to invest in any BlackRock funds and has not been prepared in connection with any such offer. Issued by BlackRock Investment Management (UK) Limited, authorised and regulated by the Financial Conduct Authority. Registered office: 12 Throgmorton Avenue, London, EC2N 2DL. Tel: + 44 (0)20 7743 3000. Registered in England and Wales No. 02020394. For your protection telephone calls are usually recorded. Please refer to the Financial Conduct Authority website for a list of authorised activities conducted by BlackRock. Please be advised that BlackRock Investment Management (UK) Limited is an authorised Financial Services provider with the South African Financial Services Conduct Authority, FSP No. 43288.


